Sparked in 2018 by a Cross-Agency Priority (CAP) Goal: Leveraging Data as a Strategic Asset, the Federal Government drafted the Federal Data Strategy which outlines a “whole-of-government vision and offers guidance on how agencies should manage and use Federal data.” Framed by ten (10) guiding principles and forty (40) related practices, the Federal Data Strategy looks to leverage the value of Federal data.
Implementing Government-wide dashboards and infrastructure is one of eleven (11) Federal Data Strategy Action Plans for 2021, remaining a Foundational Activity throughout the 10-year initiative. As a result, there has been an ever-increasing focus on data utilization across all branches of government, many agencies significantly growing their use of data visualizations or business intelligence dashboards. These have enabled organizations to quickly snapshot trends, drive key decision-making, and efficiently communicate data in a way that broad audiences will understand. Most of the time.
What makes one dashboard better than another? Why are some easier to grasp while others leave the viewer wondering what the takeaway should be? Is there a strategy of thinking that produces a more comprehensive analysis? Possibly.
Analytical thinking, the ability to systematically examine information to identify significant facts and draw conclusions, is consistently a key attribute for successful data analysts. In simpler terms, analytical thinkers are able to take large amounts of information or data and break it into smaller parts and basic principles.
From a purely data analytics standpoint, analytical thinking is ideal. Ingest the data, find the trends, use the trends (or lack thereof) to reach conclusions and provide numerically based answers to questions. For instance, the organization decreased program expenditures by 18% last fiscal year and saw a significant dip in the burn rate in the month of June. Great information for the budget and program office, but how does this information contribute to the strategic decision making of the organization moving forward? How do you find the ‘why’ in these data? Critical thinking.
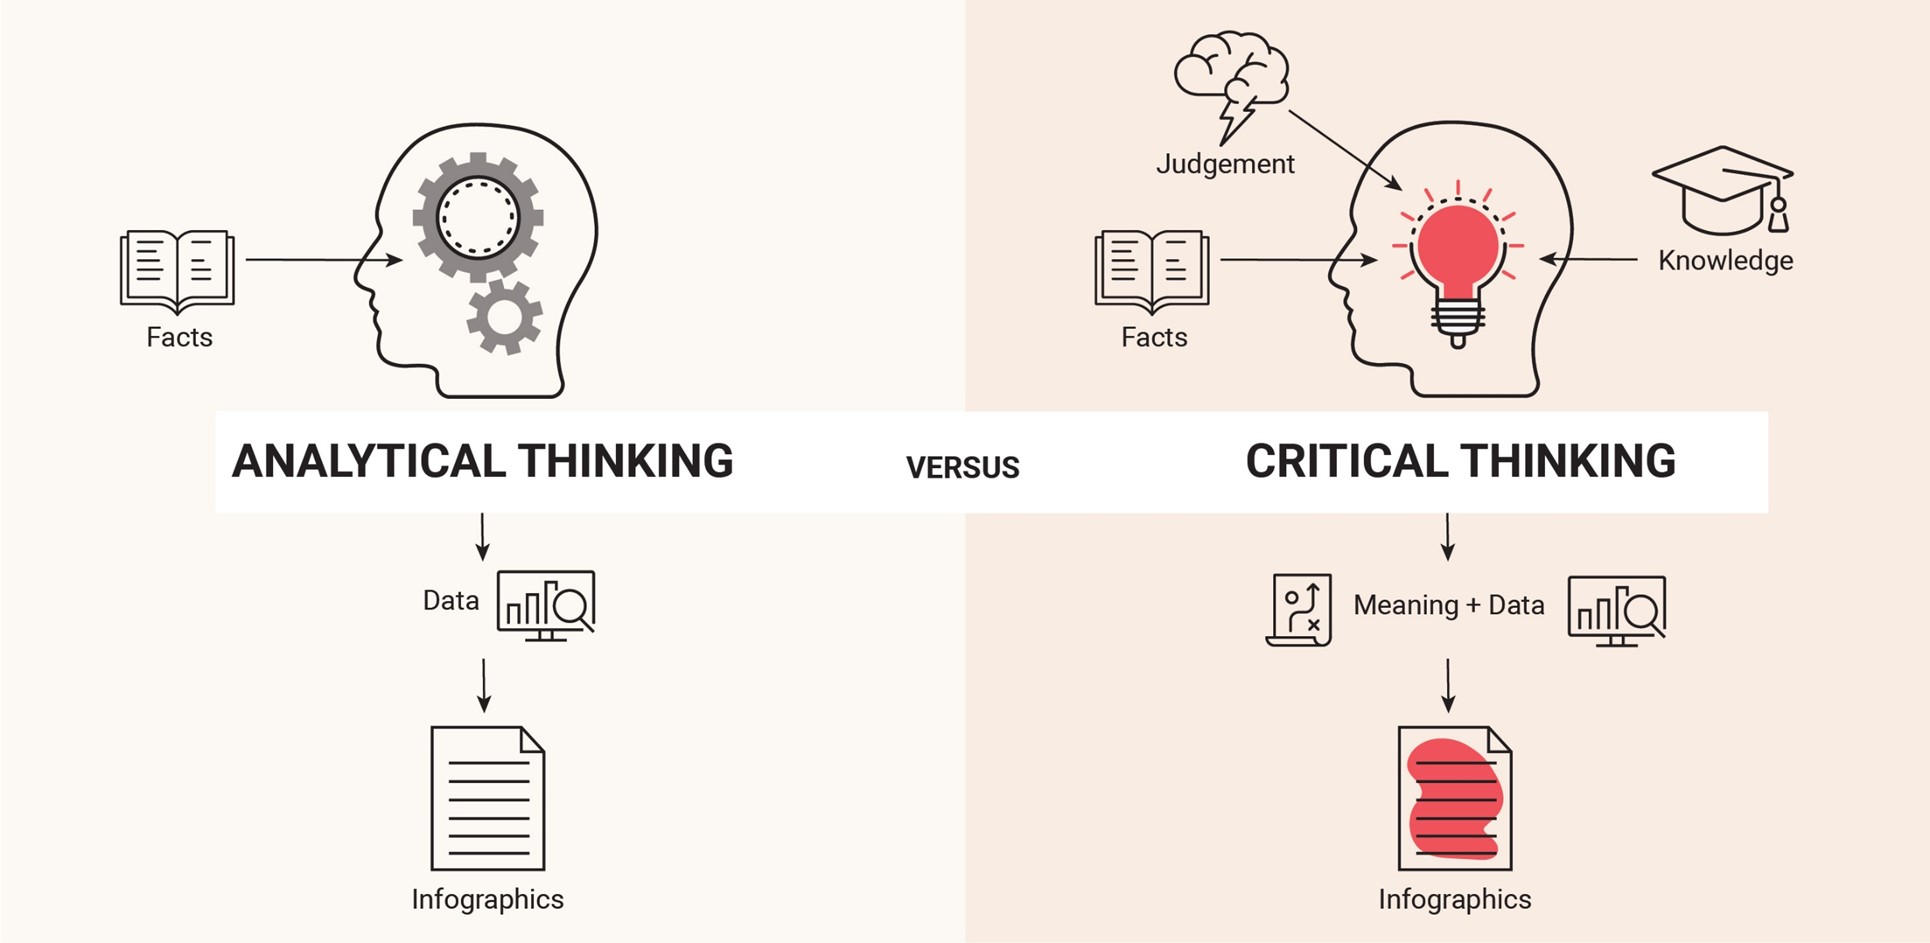
Critical thinking is a powerful skill that has the potential to change the dynamic of an organization’s analysis. Whereas analytical thinking is more linear and systematic, critical thinking is the holistic approach. Although it involves breaking down information in a logical and systematic manner, the differentiator is that critical thinking involves the application of other outside knowledge and information to drive decisions. Analytical thinking is fact based; critical thinking is judgement based. Why is this important in data visualization? That’s easy. Critical thinking applies meaning to the analyzed data, which in turn make visualizations and dashboards more practical to the user.
For example, if the organization decreased program expenditures by 18% last fiscal year, critical thinking enables us to apply our outside knowledge to formulate an explanation for this that could go beyond noting a decreased burn in June. Is the reduction due to more streamlined operations? Closing out a significant, high-resource milestone? Performance or staffing issues?
By incorporating the outside knowledge and experience applied through critical thinking, the data analysis can be further reviewed to find the ‘why,’ and then capitalizing or mitigating appropriately, and developing an approach for how (or if) to carry the findings forward. In other words, in this scenario, should the organization expect the reduction to carry over into future fiscal years?
Critical thinking is not a magical panacea that will automatically produce leaders in data analysis and visualizations. It is, however, an effective tool that can add to your visualization development process toolbox. Is your organization struggling to find applicability in your data analysis, finding yourselves ‘data rich, information poor’? Switch up the process. Apply critical thinking elements to your data analysis. Walk through the steps of critical thinking and watch your data driven decision making move forward with better information.
Jessica Underwood is a leader within the Changeis Training & Strategic Communications Community of Practice (CoP). She has over 22 years of experience in Government service delivery and program management, with a focus on strategy formulation and data analytics.